
Skip to content
James Wong Homes

Postal district · RCR · OCR

District 14 Property Market: Resale prices, tenure, supply and buyer and seller considerations

District 14 covers Geylang, Sims Avenue, Paya Lebar, Dakota, Guillemard Road, Eunos and Kembangan. In the 12 months to September 2026 there were 615 resales of private apartments and condominiums here, in 121 developments, and 94 of those developments had fewer than five.

Geylang · Sims · Paya Lebar · Dakota · Guillemard · Eunos · Kembangan

Last updated
5 Oct 2026
Last fact-checked
5 Oct 2026
Data period
Oct 2025 – Sept 2026
Data extracted
5 Oct 2026

Snapshot

CalculatedResales
615
12 months to September 2026, in 121 developments
CalculatedResales in freehold developments
44%
268 resales in 103 developments
CalculatedDevelopments with fewer than five resales
94 of 121
42 of them had exactly one
CalculatedMedian resale price per sq ft: 99-year, lease from 2015
$2,271
Median size 700 sq ft; 143 resales in 4 developments, 105 of them in one
CalculatedMedian resale price per sq ft: 99-year, lease 2000 to 2014
$1,828
Median size 818 sq ft; 160 resales in 10 developments
CalculatedMedian resale price per sq ft: freehold
$1,556
Median size 893 sq ft; 268 resales in 103 developments

Source: URA Data Service: private residential property transactions (Urban Redevelopment Authority), Oct 2025 – Sep 2026. Extracted 5 Oct 2026.

Transport and school anchors

  • East-West Line: Kallang, Aljunied, Paya Lebar, Eunos and Kembangan stations.
  • Circle Line: Stadium, Mountbatten, Dakota, Paya Lebar and MacPherson stations.
  • Downtown Line: Ubi and Kaki Bukit stations.
  • MOE lists four primary schools with postal codes in the district.

District 14 analysis

District 14 resale prices by tenure and lease era

Middle half of resale prices (25th percentile, median, 75th percentile) · $ · Oct 2025 – Sep 2026

  • 25th percentile to 75th percentile
  • Median
Freehold / 999-year$1,300,000

$808,000 to $1,760,000

99-year, before 2000$1,680,000

$1,400,000 to $1,830,000

99-year, 2000 to 2014$1,330,000

$896,000 to $1,840,000

99-year, from 2015$1,590,000

$1,180,000 to $2,070,000

The scale starts at $500,000, not zero, so the bands show position, not size.

Middle half of resale prices in District 14 in the 12 months to September 2026, by tenure and lease era. freehold / 999-year: $808,000 to $1.76M, median $1.30M, from 268 resales; 99-year, before 2000: $1.40M to $1.83M, median $1.68M, from 44 resales; 99-year, 2000 to 2014: $896,000 to $1.84M, median $1.33M, from 160 resales; 99-year, from 2015: $1.18M to $2.07M, median $1.59M, from 143 resales.

Source: URA Data Service: private residential property transactions (Urban Redevelopment Authority), Oct 2025 – Sep 2026. Extracted 5 Oct 2026.

Single-unit resales of apartments and condominiums. Calculated from URA's caveat records.

Show the data as a table
District 14 resale prices by tenure and lease era: data table
Tenure and lease era25th percentileMedian75th percentile
Freehold / 999-year$808,000$1,300,000$1,760,000
99-year, before 2000$1,400,000$1,680,000$1,830,000
99-year, 2000 to 2014$896,000$1,330,000$1,840,000
99-year, from 2015$1,180,000$1,590,000$2,070,000

District 14 resale prices per square foot by tenure and lease era

Middle half of resale prices per square foot (25th percentile, median, 75th percentile) · $ per sq ft · Oct 2025 – Sep 2026

  • 25th percentile to 75th percentile
  • Median
Freehold / 999-year$1,556 per sq ft

$1,394 to $1,712 per sq ft

99-year, before 2000$1,414 per sq ft

$1,372 to $1,479 per sq ft

99-year, 2000 to 2014$1,828 per sq ft

$1,446 to $1,942 per sq ft

99-year, from 2015$2,271 per sq ft

$2,152 to $2,397 per sq ft

The scale starts at $1,000 per sq ft, not zero, so the bands show position, not size.

Middle half of resale prices per square foot in District 14 in the 12 months to September 2026, by tenure and lease era. freehold / 999-year: $1,394 to $1,712, median $1,556, from 268 resales; 99-year, before 2000: $1,372 to $1,479, median $1,414, from 44 resales; 99-year, 2000 to 2014: $1,446 to $1,942, median $1,828, from 160 resales; 99-year, from 2015: $2,152 to $2,397, median $2,271, from 143 resales.

Source: URA Data Service: private residential property transactions (Urban Redevelopment Authority), Oct 2025 – Sep 2026. Extracted 5 Oct 2026.

Price divided by strata floor area. Single-unit resales. Calculated from URA's caveat records.

Show the data as a table
District 14 resale prices per square foot by tenure and lease era: data table
Tenure and lease era25th percentileMedian75th percentile
Freehold / 999-year$1,394 per sq ft$1,556 per sq ft$1,712 per sq ft
99-year, before 2000$1,372 per sq ft$1,414 per sq ft$1,479 per sq ft
99-year, 2000 to 2014$1,446 per sq ft$1,828 per sq ft$1,942 per sq ft
99-year, from 2015$2,152 per sq ft$2,271 per sq ft$2,397 per sq ft

Private property

Not one market

District 14 takes in Geylang, Sims Avenue and Sims Drive, Paya Lebar, Dakota, Guillemard Road, Eunos and Kembangan. URA places most of it in the Rest of Central Region and part in the Outside Central Region: of the 615 resales in the 12 months to September 2026, 461 were in the first and 154 in the second.

By number of developments this is a freehold district: 178 of the 198 developments that recorded a sale in the past five years are freehold. By number of resales it is not. The 103 freehold developments with a resale in the 12 months made 268 of the 615, or 44%. Eighteen developments on 99-year leases made the other 347.

The four groups sold at different levels and in different sizes, so the figures below are given for each group, never for the district as a whole.

Stock profile

Developments in District 14 by tenure and lease era
Tenure and lease eraDevelopmentsWith a resaleResales
Freehold or 999-year178103268
99-year, lease before 20005444
99-year, lease 2000 to 20141010160
99-year, lease from 201554143
All198121615

Source: URA Data Service: private residential property transactions (Urban Redevelopment Authority), Sep 2021 – Sep 2026. Extracted 5 Oct 2026.

Developments: those with any sale recorded from September 2021. With a resale, and resales: in the 12 months to September 2026. A count of developments that appear in URA's caveat records, not of all developments standing in the district.

Of the 103 freehold developments with a resale, 42 had exactly one in the 12 months and 89 had fewer than five. A further 75 freehold developments that recorded a sale in the past five years had no resale at all in the 12 months.

What sold each year

Private home sales in District 14 by type of sale
YearNew salesSub salesResales
202221690670
202330115565
202421109730
2025697710
2026 (Jan to Sep)015458

Source: URA Data Service: private residential property transactions (Urban Redevelopment Authority), Jan 2022 – Sep 2026. Extracted 5 Oct 2026.

Apartments and condominiums. URA's types of sale: a new sale and a sub sale are made before the development's Certificate of Statutory Completion and strata titles are issued, by the developer and by a purchaser; a resale is made after.

Resales have run between 565 and 730 a year. New sales by developers fell from 216 in 2022 to 6 in 2025, and none was recorded in the first nine months of 2026.

Resale prices by tenure and lease era

District 14 resales by tenure and lease era
Tenure and lease eraResales (developments)Middle half of pricesMedian price per sq ftMedian size
Freehold or 999-year268 (103)$808,000 to $1.76M$1,556893 sq ft
99-year, lease before 200044 (4)$1.40M to $1.83M$1,4141,227 sq ft
99-year, lease 2000 to 2014160 (10)$896,000 to $1.84M$1,828818 sq ft
99-year, lease from 2015143 (4)$1.18M to $2.07M$2,271700 sq ft

Source: URA Data Service: private residential property transactions (Urban Redevelopment Authority), Oct 2025 – Sep 2026. Extracted 5 Oct 2026.

Middle half: a quarter of resales were below the lower figure and a quarter above the higher one. Calculated.

The 99-year homes with leases from 2015 had the highest median price per square foot, $2,271, and the smallest homes, a median of 700 sq ft. Freehold homes had a median of $1,556 per square foot, below both groups of 99-year homes with leases from 2000. The 99-year homes with leases before 2000 were the largest, a median of 1,227 sq ft, and had the lowest median price per square foot, $1,414.

Four developments in the newest group had a resale, and 105 of the 143 resales were in one of them, Parc Esta.

What each size cost

Median price of District 14 resales by size and lease era
Size (sq ft)Freehold / 999-year99-year, before 200099-year, 2000 to 201499-year, from 2015
under 500$699,000 (61)–$850,000 (19)$950,000 (24)
500 to 799$925,000 (55)–$1.05M (60)$1.49M (76)
800 to 1,199$1.51M (90)$1.35M (17)$1.78M (53)$2.40M (35)
1,200 to 1,599$1.88M (42)$1.75M (27)$2.09M (24)$3.19M (8)
1,600 and over$2.84M (20)–Low sample (4)–

Source: URA Data Service: private residential property transactions (Urban Redevelopment Authority), Oct 2025 – Sep 2026. Extracted 5 Oct 2026.

Number of resales in brackets. Fewer than five resales is shown as low sample, with no median. Calculated.

At 800 to 1,199 sq ft, the band with the most freehold resales, the medians were $1.51M for freehold, $1.35M for 99-year leases before 2000, $1.78M for leases from 2000 to 2014 and $2.40M for leases from 2015. The last figure rests on 35 resales in three developments, 32 of them in Parc Esta.

Homes under 500 sq ft made 104 of the 615 resales, or 17%. Their median prices were $699,000 for freehold (61 resales in 35 developments), $850,000 for 99-year leases from 2000 to 2014 (19 in three developments) and $950,000 for leases from 2015 (24 in three).

Several cells rest mostly on one or two developments. In the column for leases from 2015, Parc Esta made 19 of the 24 resales under 500 sq ft and 7 of the 8 at 1,200 to 1,599 sq ft. In the column for leases from 2000 to 2014, Sims Urban Oasis made 13 of the 19 under 500 sq ft, and Sims Urban Oasis and euHabitat together made 52 of the 60 at 500 to 799 sq ft. Parc Esta also made 47 of the 76 resales with leases from 2015 at 500 to 799 sq ft. In the column for leases before 2000, two developments made 15 of the 17 resales at 800 to 1,199 sq ft and two made 25 of the 27 at 1,200 to 1,599 sq ft.

Where the resales are

Developments with the most resales in District 14
Parc Esta (Sims Avenue)99-year from 2018105$2,309$1.68M
Sims Urban Oasis (Sims Drive)99-year from 201464$1,904$1.27M
euHabitat (Jalan Eunos)99-year from 201039$1,429$794,000
Simsville (Geylang East Avenue 2)99-year from 199422$1,469$1.79M
Park Place Residences at PLQ (Paya Lebar Road)99-year from 201518$2,292$1.58M
The Antares (Mattar Road)99-year from 201817$2,056$1.39M
Vacanza @ East (Lengkong Tujoh)Freehold17$1,628$1.44M
Tre Residences (Geylang East Avenue 1)99-year from 201414$1,882$1.67M
Waterbank at Dakota (Dakota Crescent)99-year from 200912$2,064$1.81M
Central Grove (Geylang East Avenue 1)99-year from 199711$1,381$1.70M

Source: URA Data Service: private residential property transactions (Urban Redevelopment Authority), Oct 2025 – Sep 2026. Extracted 5 Oct 2026.

Medians are of the resales in that development in the 12 months and depend on which sizes and floors happened to sell. Calculated.

Parc Esta had 105 resales, 17% of the district's total, and Sims Urban Oasis 64. The five developments with the most resales made 40% of them and the top ten 52%. Nine of the top ten are on 99-year leases. Ninety-four of the 121 developments with a resale had fewer than five.

Every sale on record for a development is on the Property Research page. The five with the most resales: Parc Esta, Sims Urban Oasis, euHabitat, Simsville and Park Place Residences at PLQ.

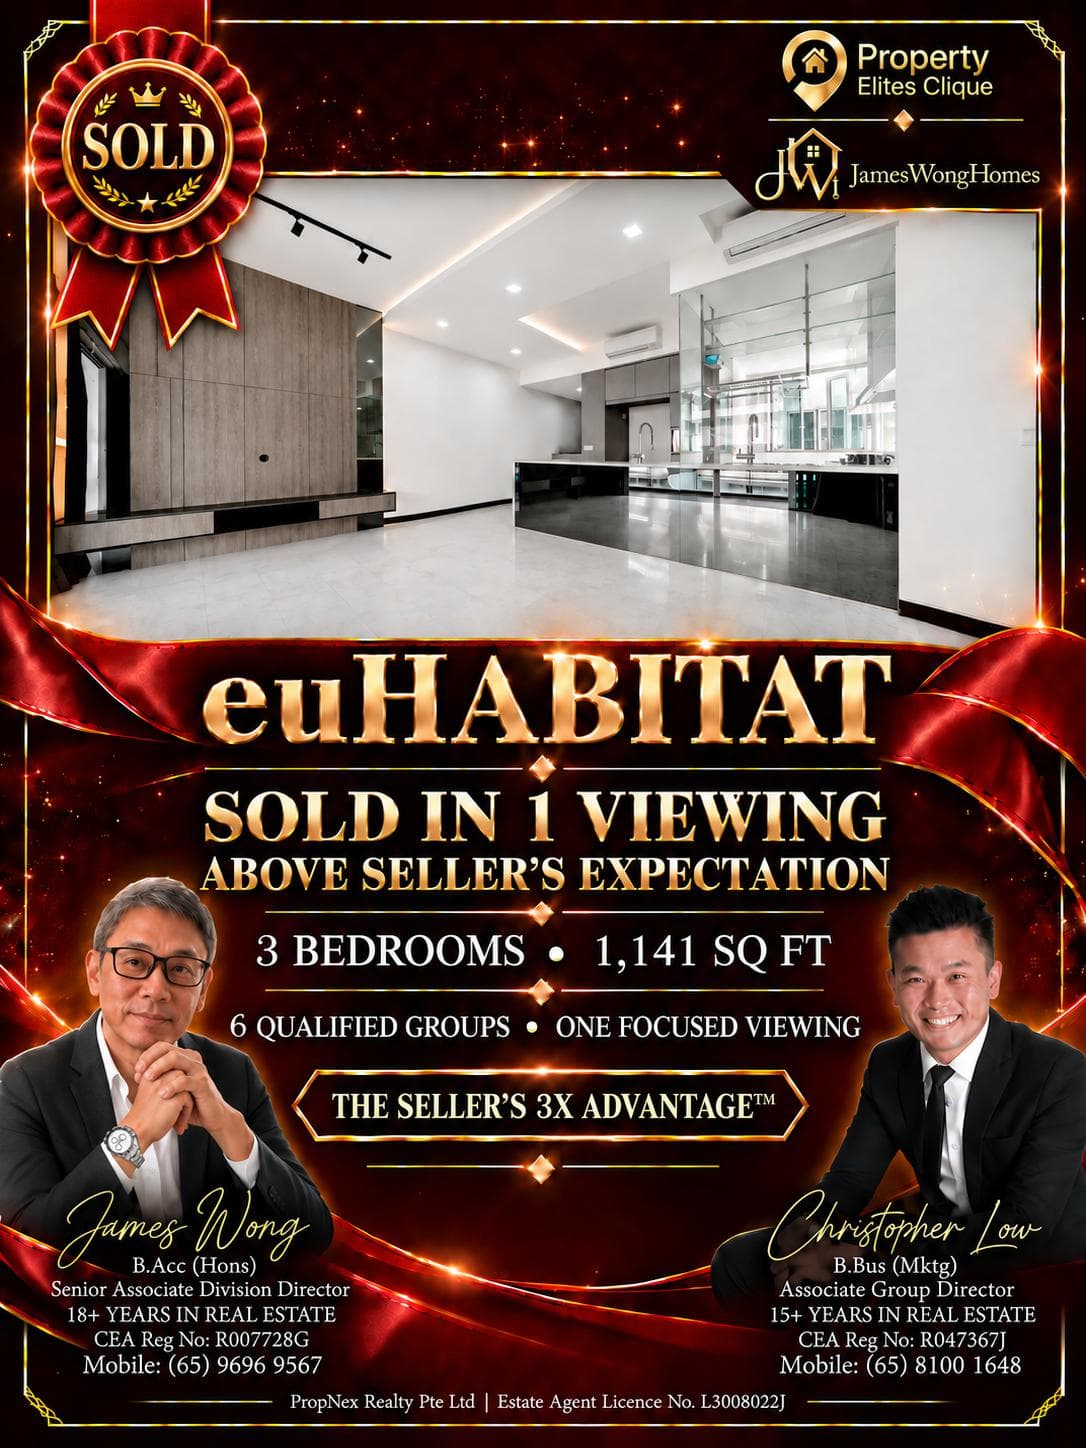
Disclosure: James Wong has sold a home in euHabitat. Its record: euHabitat.

How much sale evidence a development here has of its own is examined in District 14: 103 freehold developments shared 268 resales.
Supply, pipeline and planning

What developers are selling

New sales by developers in District 14
Development (street)TenureNew salesMedian price per sq ftMedian price
Zyanya (Lorong 25A Geylang)Freehold2Low sampleLow sample

Source: URA Data Service: private residential property transactions (Urban Redevelopment Authority), Oct 2025 – Sep 2026. Extracted 5 Oct 2026.

Units sold by developers in the 12 months, as caveated. Not the number of units in the development. Calculated.

Developers sold two homes in the 12 months, both in one development, which is too few for a median. Purchasers in Penrose, a development not yet at the stage where URA counts a sale as a resale, made 28 sub sales.

What this page does not cover

Future Government Land Sales sites, en-bloc redevelopments and launches that have not yet recorded a sale are not listed here. The table shows only developments in which URA has recorded a developer's sale in the period.

Schools and connectivity

MRT

Eleven MRT stations have postal codes in District 14. Paya Lebar is an interchange between the East-West and Circle lines. Kallang, Aljunied, Eunos and Kembangan are on the East-West Line. Stadium, Mountbatten, Dakota and MacPherson are on the Circle Line. Ubi and Kaki Bukit are on the Downtown Line. MacPherson is also a Downtown Line station; SLA lists that part of it under District 13.

A station being in the district says nothing about how far it is from a given home. Check the walking route from the address itself.

Primary schools

MOE's school directory lists four primary schools with postal codes in District 14: Canossa Catholic Primary School, Geylang Methodist School (Primary), Kong Hwa School and Maha Bodhi School.

A postal district is not a school catchment. Check the home's own address against MOE's current Primary 1 registration rules before relying on a school.

What it may mean for buyers

  • Decide which group you are buying in before comparing prices. At 800 to 1,199 sq ft the medians were $1.51M for freehold and, for 99-year leases, $1.35M (before 2000), $1.78M (2000 to 2014) and $2.40M (from 2015).
  • Freehold did not carry the highest price per square foot in this district. Its median, $1,556, was below the medians of both groups of 99-year homes with leases from 2000.
  • Check how many recent sales the development has. In 42 freehold developments there was exactly one resale in the 12 months, and a single transaction is weak evidence of value.
  • For a 99-year home with an older lease, ask CPF Board and your bank early whether the remaining lease affects the CPF you may use and the loan you can get.

What it may mean for sellers and owners

  • If you own a freehold home here, your development may have had one resale in the past year or none. 89 of the 103 freehold developments with a resale had fewer than five.
  • With few sales in your own development, the comparison has to come from other developments. Be ready to show which ones are comparable in tenure, size and street.
  • A district-wide figure is unlikely to describe your home. The median price per square foot of the four groups ranged from $1,414 to $2,271.
  • In Parc Esta, Sims Urban Oasis and euHabitat, buyers have many recent sales in the same development to compare with yours.

Analysis · opinion

James's interpretation

I think of District 14 as two markets that share a postal district. One is a small number of 99-year developments around Sims Avenue, Paya Lebar, Dakota and Eunos, where resales are frequent and the evidence is plentiful. The other is 178 freehold developments, 141 of which had two resales or fewer in the 12 months.

The mistake I would avoid is carrying a figure from one into the other. The price per square foot in a 99-year development with many resales tells you little about a freehold home elsewhere in the district, and the reverse is also true.

For a freehold home here, my view is that the work is in building the comparison from several developments, because one development seldom has enough sales of its own.

Homes in District 14

Homes James is marketing or has sold here.

SOLD post: euHabitat

SoldCondoCase study available

euHabitat: sold after one viewing session

euHabitat · 3-bedroom · 1,141 sq ft

Six qualified buyer groups attended the first viewing session, with an offer the next day and a result above the seller's expectation.

  • Seller's 3X Advantage™

View sold story

Guides for this decision

Guide

Sell your HDB flat first, or buy the next home first?

Sell first: for ABSD, your flat counts as sold once the Option to Purchase for its sale has been exercised, so you can commit to the next home before the sale completes. You may need interim housing or an extension of stay.

Updated 3 Oct 2026

Videos and case studies

Limitations

URA's records cover only sales with a caveat lodged, and recent months are incomplete. September 2026 in particular is likely to gain sales as more caveats are lodged.

URA records some sales without a development name. Those cannot be placed in a district from the feed used here and are not counted.

The records give a home's size, floor range, tenure and price. They do not give its condition, facing, layout or renovation, and a development's median depends on which of its homes happened to sell.

Freehold developments carry no lease start year in the records, and the start year of a 999-year lease says nothing about when the homes were built, so the age of these developments is not known from this data. A 99-year development's lease start year is not its completion year.

The stock table counts developments that had at least one sale in the past five years. A development where nothing was sold is missing from it.

Future Government Land Sales sites, en-bloc redevelopments and launches that have not yet recorded a sale are not covered.

Methodology

The figures are calculated from URA's records of caveated sales in postal district 14, read through URA's Data Service on 5 October 2026. The feed holds the past five years, so the earliest sale is from September 2021. The headline period is the 12 months to September 2026; the year-by-year table begins in January 2022.

Included: single-unit sales of apartments and condominiums with a strata floor area. Left out: 29 sales of landed and strata-landed houses and 1 caveat covering more than one unit.

Each development is grouped by tenure and, for 99-year developments, by the year its lease began. Where a record of a 99-year sale gives no start year, the year is taken from the development's other records. Leases of more than 900 years are grouped with freehold.

Floor area is converted at 10.7639 square feet to the square metre, and price per square foot is the price divided by that area. The size bands are under 500, 500 to 799, 800 to 1,199, 1,200 to 1,599, and 1,600 sq ft and over. Medians and quartiles are taken across the sales in each group, with quartiles by linear interpolation. A group with fewer than five sales is marked low sample. Prices of $1M and over are rounded to the nearest $10,000, lower prices to the nearest $1,000, and percentages to the nearest whole number.

Figures are given by group. No single figure is used to describe the whole district, because the groups differ in lease era, size and tenure.

District 14 has no development on a 999-year lease in these records, so the group shown as freehold or 999-year is all freehold here.

New sale, sub sale and resale
URA's types of sale. A new sale is a sale by the developer, and a sub sale a sale by a purchaser, before the Certificate of Statutory Completion and the strata titles have been issued for all units in the development. A resale is a sale after they have been issued.
Caveat
A notice lodged with the Singapore Land Authority, usually by the buyer's lawyer, after an option is exercised or an agreement signed. URA's records are of caveats lodged, so a sale with no caveat is not in them.
Postal district
One of 28 areas defined by the first two digits of the postal code. District boundaries are not the same as HDB towns or URA planning areas.
Tenure and lease era
Freehold developments and those on leases of more than 900 years, most of them 999-year, are grouped together. A 99-year development is grouped by the year its lease began, which is not the year the homes were completed. Newer and older on this page refer to the year the lease began.
Middle half (25th to 75th percentile)
The range that the middle half of sales fall in. A quarter of sales were below the 25th percentile and a quarter were above the 75th.
Price per square foot
The price divided by the strata floor area in URA's record.
Low sample
Fewer than five sales in a group. No median is shown, because one or two sales can move it a long way.

How all research on this site is built

Sources

  1. 1.
    URA Data Service: private residential property transactions

    Urban Redevelopment Authority · Period: Sep 2021 – Sep 2026 · Extracted 5 Oct 2026

    Caveated sales of apartments and condominiums in the district.

  2. 2.
    REALIS data dictionary

    Urban Redevelopment Authority · Period: Oct 2026 · Extracted 5 Oct 2026

    Definitions of new sale, sub-sale and resale.

  3. 3.
    OneMap address search

    Singapore Land Authority · Period: Oct 2026 · Extracted 5 Oct 2026

    Postal codes of MRT stations.

  4. 4.
    School Directory and Information: general information of schools

    Ministry of Education · Period: Oct 2026 · Extracted 5 Oct 2026

    Primary schools by postal code.

All districts

General information only, not financial, legal or tax advice. Figures reflect the data period shown and may since have changed; your own circumstances will differ. Full disclaimer.

Planning your next move?

Need help comparing District 14 with another area?

Tell James which estates you are weighing up. He will line up the transactions, supply and trade-offs side by side.

Prefer to call? +65 9696 9567

I usually reply within one working day.

Messages go directly to James. Your details are used only to respond to your enquiry. See the privacy notice.