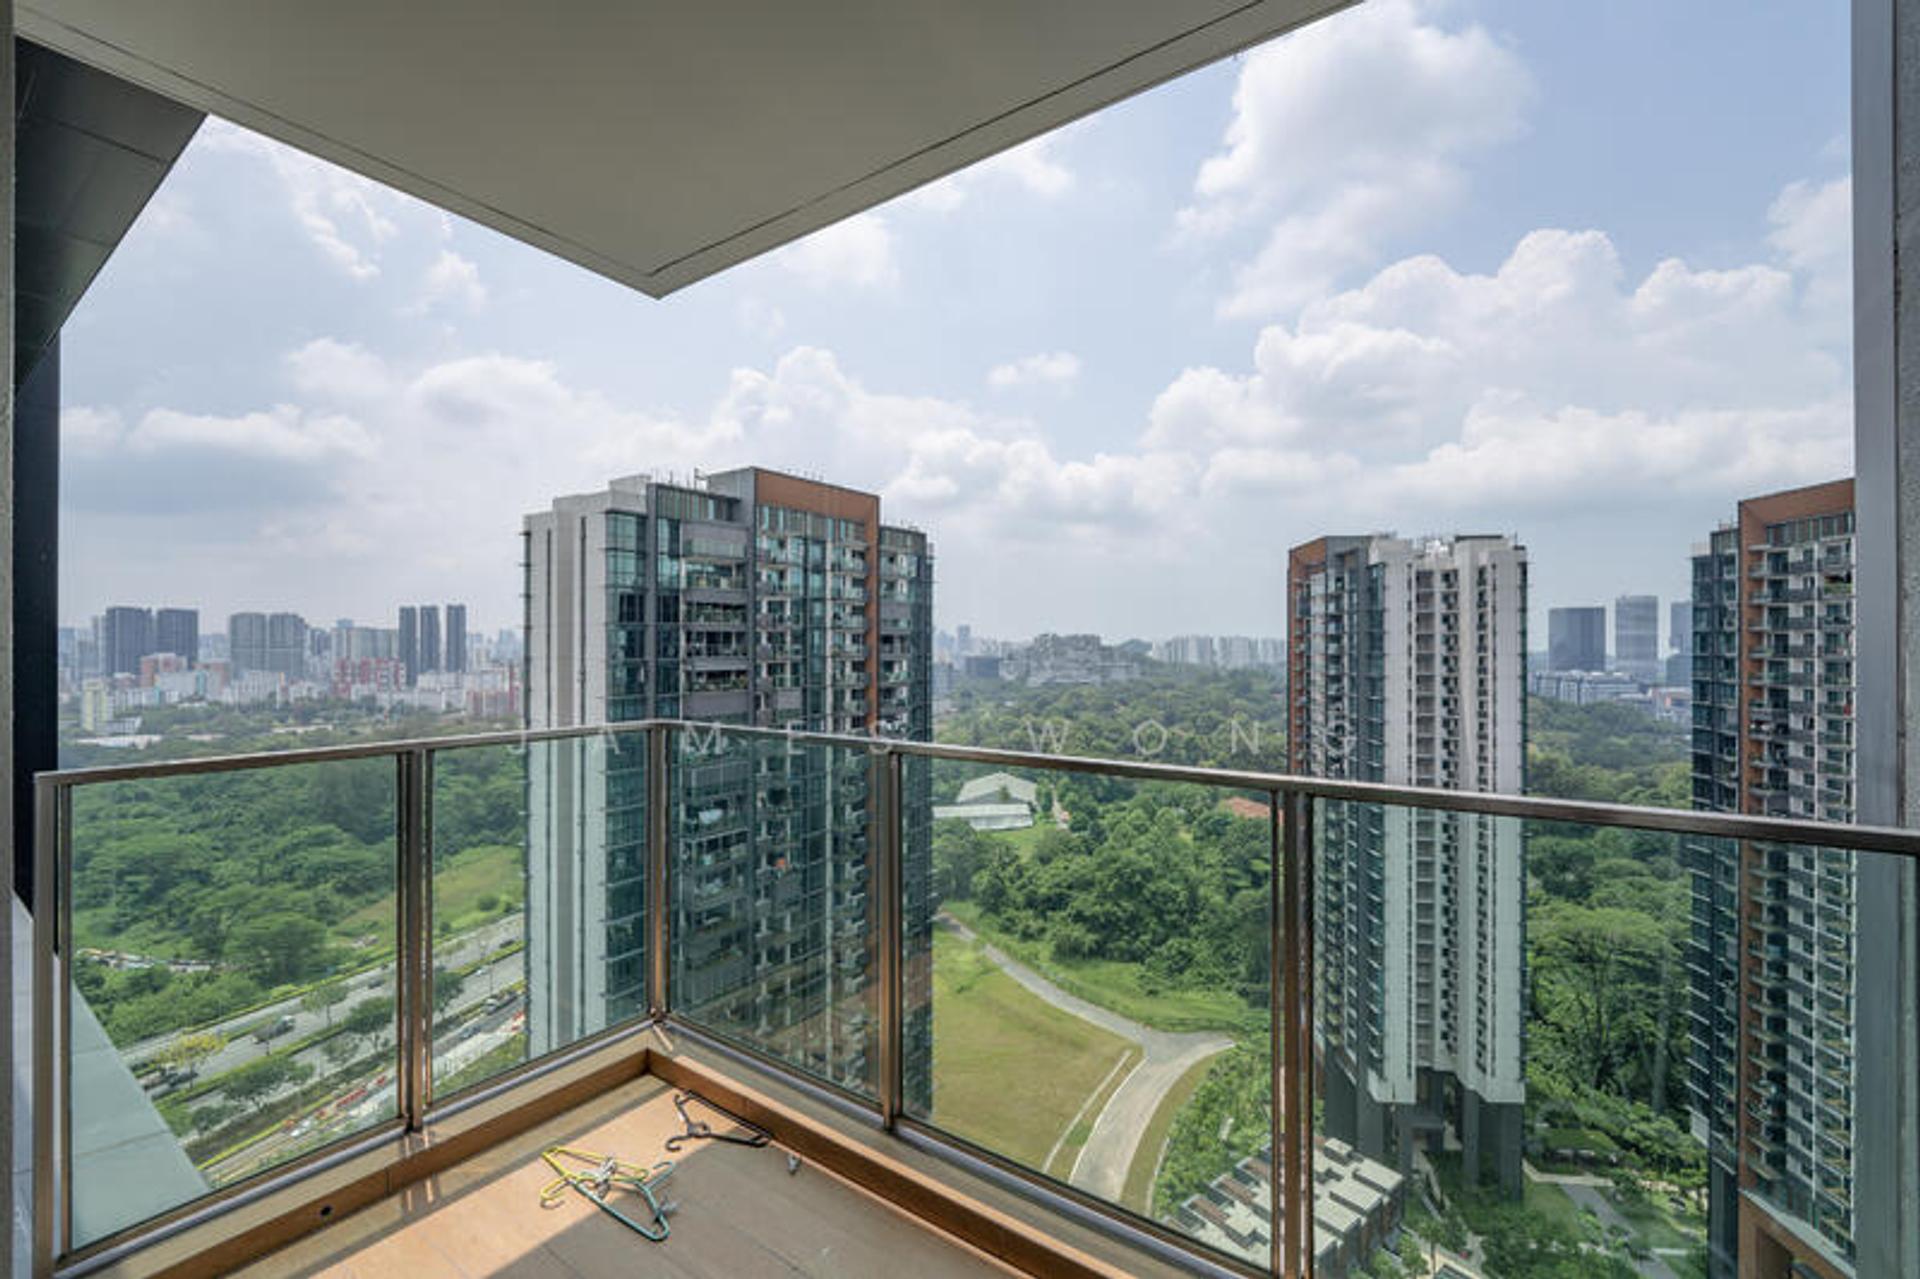

| Stage | Project or site | Land | Reported launch average |
|---|---|---|---|
| Earlier launch | River Green | About $1,325 psf ppr | $3,130 psf, August 2025 |
| Later launch | River Modern | About $1,420 psf ppr | $3,266 psf, March 2026 |
| Next land parcel | River Valley Green C | About $1,730 psf ppr, June 2026 | Not confirmed. What could the extra cost mean for its future home prices? |
Source: Past Sales Sites (Government Land Sales awards workbook) (Urban Redevelopment Authority), Awards 13 Apr 2023 to 18 Sep 2026; workbook read 22 Oct 2026. Extracted 22 Oct 2026.
URA land awards matched to Wing Tai and GuocoLand launch releases, listed under Sources. Parcel C has no confirmed selling price in the developer material checked. Its worked scenarios appear in the next-launch comparison below.
Follow the same area, from one land purchase to the next
Comparing a suburban site with a prime-city site tells us little about how land costs are changing. A more useful starting point is to follow nearby plots over time. The chart below keeps each area in its own colour, so the sequence is easy to see.
Nearby sites. Later purchases. Higher land costs.
Land rates in S$ psf ppr. Each row is a different site, in the order it was bought; the sequence is not identical-land appreciation.
Land price per square foot of permitted gross floor area (psf ppr), from URA's award price and GFA · $ psf ppr · Awards Apr 2024 to Jun 2026
River Valley / Zion Road
- Zion Road A, Apr 2024$1,202 psf ppr
- River Valley A, Jun 2024$1,325 psf ppr
- Zion Road B, Aug 2024$1,304 psf ppr
- River Valley B, Feb 2025$1,420 psf ppr
- River Valley C, Jun 2026$1,730 psf ppr
Upper Thomson Road
- Upper Thomson B, Apr 2024$905 psf ppr
- Upper Thomson A, Oct 2025$1,062 psf ppr
Dunearn Road
- Earlier site, Jul 2025$1,410 psf ppr
- Later site, May 2026$1,625 psf ppr
River Valley / Zion Road: Zion Road A $1,202 (Apr 2024), River Valley A $1,325 (Jun 2024), Zion Road B $1,304 (Aug 2024), River Valley B $1,420 (Feb 2025), River Valley C $1,730 (Jun 2026). Upper Thomson Road: Parcel B $905 (Apr 2024), Parcel A $1,062 (Oct 2025). Dunearn Road: $1,410 (Jul 2025), $1,625 (May 2026). All in $ psf ppr.
Source: Past Sales Sites (Government Land Sales awards workbook) (Urban Redevelopment Authority), Awards 13 Apr 2023 to 18 Sep 2026; workbook read 22 Oct 2026. Extracted 22 Oct 2026.
One colour follows one nearby group. Every qualifying award in each group is shown, including the small dip within the River Valley / Zion Road sequence. Separate sites, with different use and development conditions. All qualifying awards in these three groups are shown. Source: URA Past Sales Sites workbook, checked 22 Oct 2026.
Show the data as a table
| Category | Group | $ psf ppr |
|---|---|---|
| Zion Road A, Apr 2024 | River Valley / Zion Road | $1,202 psf ppr |
| River Valley A, Jun 2024 | River Valley / Zion Road | $1,325 psf ppr |
| Zion Road B, Aug 2024 | River Valley / Zion Road | $1,304 psf ppr |
| River Valley B, Feb 2025 | River Valley / Zion Road | $1,420 psf ppr |
| River Valley C, Jun 2026 | River Valley / Zion Road | $1,730 psf ppr |
| Upper Thomson B, Apr 2024 | Upper Thomson Road | $905 psf ppr |
| Upper Thomson A, Oct 2025 | Upper Thomson Road | $1,062 psf ppr |
| Earlier site, Jul 2025 | Dunearn Road | $1,410 psf ppr |
| Later site, May 2026 | Dunearn Road | $1,625 psf ppr |
River Valley / Zion Road: the five awards run from about $1,202 psf ppr in April 2024 to $1,730 in June 2026. The middle steps include both rises and a small dip, but the later sites were acquired at a higher land rate overall.
Upper Thomson: Parcel B was awarded at about $905 psf ppr in April 2024. Parcel A followed at about $1,062 in October 2025, roughly 17% higher.
Dunearn Road: the July 2025 award was about $1,410 psf ppr. The next award, in May 2026, was about $1,625 — around 15% higher.
These are different plots within the same road or nearby area. Their access, scale and permitted uses still matter. Zion Road Parcel A, for example, includes a substantial long-stay serviced-apartment requirement. The land rates cover each whole development allowance, so they are not pure apartment-only costs. URA’s site-use conditions.
Reading the figures: “psf ppr” means the land price divided by the gross floor area the developer is permitted to build. It is a way to compare land acquisitions. It is not an apartment selling price. Dates throughout this article are award dates unless labelled otherwise.
The rise extends beyond one expensive tender
The broader URA record also points upwards. Across the 47 residential-led awards examined here, the middle-priced site cost about $1,146 psf ppr in 2023, compared with $1,526 in 2026 to date. Removing Dover Drive’s $1,556 award barely changes the latter figure: it becomes about $1,515.
This supports a broader rising-cost story rather than one built around Dover alone. It does not mean an identical plot has risen by the same amount: the Government sells a different selection of sites each year.
Later does not always mean more expensive
There are useful exceptions. Lentor Gardens fell from about $985 psf ppr in April 2023 to $920 in April 2025. Dairy Farm Walk fell from about $1,020 in January 2025 to $962 in January 2026. At Media Circle, the later Parcel A award was also below the original site’s land rate.
Those examples matter to buyers. Waiting can bring a different product, a lower land acquisition cost, or stronger competition. The case for buying an earlier project should rest on its actual price and suitability, supported by the nearby pipeline.
From land purchases to prices buyers have already paid
River Valley is useful because several of these sites have already become launches. We can move beyond a land-only comparison and see the prices reported when homes actually sold.
What the land cost
The land purchases have become real home-price references
Land price per square foot of permitted gross floor area, from URA's award price and GFA · $ psf ppr · Awards Apr 2024 to Feb 2025
- Zyon Grand$1,202 psf ppr
- River Green$1,325 psf ppr
- River Modern$1,420 psf ppr
Land: Zyon Grand $1,202, River Green $1,325, River Modern $1,420, all $ psf ppr.
Source: Past Sales Sites (Government Land Sales awards workbook) (Urban Redevelopment Authority), Awards 13 Apr 2023 to 18 Sep 2026; workbook read 22 Oct 2026. Extracted 22 Oct 2026.
Show the data as a table
| Category | Land: S$ psf ppr |
|---|---|
| Zyon Grand | $1,202 psf ppr |
| River Green | $1,325 psf ppr |
| River Modern | $1,420 psf ppr |
What homes sold for
Historical home-price reference per square foot of stated apartment area · $ psf · Reported Aug 2025 to Mar 2026
- Zyon Grand$3,050 psf
- River Green$3,130 psf
- River Modern$3,266 psf
Developer-reported launch averages: Zyon Grand $3,050 psf, River Green $3,130 psf, River Modern $3,266 psf.
Source: Strong take-up for River Modern at launch (media release, 8 March 2026) (GuocoLand), Reported 3 Aug 2025 to 8 Mar 2026. Extracted 22 Oct 2026.
The two panels use different measures: land rates per permitted GFA and home prices per stated apartment area. All three home-price figures are developer launch results. Different projects and units; historical prices, not current offers. Sources: URA, CDL, Wing Tai, GuocoLand.
Show the data as a table
| Category | Historical home-price reference: S$ psf |
|---|---|
| Zyon Grand | $3,050 psf |
| River Green | $3,130 psf |
| River Modern | $3,266 psf |
| Project / land site | Land rate | Reported home-price reference |
|---|---|---|
| Zyon Grand · Zion Road A | $1,202 psf ppr, Apr 2024 award | $3,050 psf, launch-weekend average, reported 26 Oct 2025 |
| River Green · River Valley Green A | $1,325 psf ppr, Jun 2024 award | $3,130 psf, launch-weekend average, reported 3 Aug 2025 |
| River Modern · River Valley Green B | $1,420 psf ppr, Feb 2025 award | $3,266 psf, launch-day average, reported 8 Mar 2026 |
Source: Past Sales Sites (Government Land Sales awards workbook) (Urban Redevelopment Authority), Awards 13 Apr 2023 to 18 Sep 2026; workbook read 22 Oct 2026. Extracted 22 Oct 2026.
Land: URA workbook. Home-price references: CDL, Wing Tai, GuocoLand. All three are developer-reported launch averages. They cover different units and periods. These are historical references, not today’s available-unit quotations.
Land around $1,200–$1,325 psf ppr supported developer-reported launch averages around $3,050–$3,130 psf in this neighbourhood. Location, product and the mix of homes sold still influence what buyers pay.
River Green and River Modern give us a closer sequence along River Valley Green itself. Parcel B’s land rate was about 7% above Parcel A’s. River Modern’s reported launch average was about 4% above River Green’s. This is evidence of what happened between two different projects, not a rule that can be applied mechanically to the next one.
What could the next higher-cost plot imply?
Parcel C was awarded in June 2026 at about $1,730 psf ppr, roughly $310 above Parcel B. Its eventual apartment price was not confirmed in the developer material checked for this article. We can nevertheless use River Modern’s $3,266 launch average to build a transparent comparison scenario. Developer tender statement; subsequent pipeline update.
Assume, purely for this exercise, that both projects turn each 100 sq ft of permitted GFA into 90 sq ft of saleable apartment area. The additional land cost would then be about $344 per saleable square foot. What happens depends on how much of that difference the future developer seeks to recover from buyers.
| Scenario | Comparison figure | How it is built |
|---|---|---|
| Half the extra cost recovered | About $3,440 psf | River Modern’s historical launch average, plus half the assumed additional land cost per saleable square foot. |
| All the extra cost recovered | About $3,610 psf | The same reference, plus all the assumed additional land cost per saleable square foot. |
Source: Past Sales Sites (Government Land Sales awards workbook) (Urban Redevelopment Authority), Awards 13 Apr 2023 to 18 Sep 2026; workbook read 22 Oct 2026. Extracted 22 Oct 2026.
Assumed: 90 sq ft of saleable apartment area for each 100 sq ft of permitted GFA, so the extra $310 psf ppr is about $344 per saleable square foot.
This makes the forward-looking question tangible. If a suitable home on sale today is below a plausible next-wave comparison, it deserves examination even if its price feels high against older purchases. For perspective, a $200 psf gap on a 900 sq ft home is $180,000 before duties. That arithmetic is useful when comparing budgets; the future gap still has to materialise.
For another neighbourhood, repeat the process with its own recent launches and similar-cost sites. Match the location and product first, then use land cost to explain the difference. A suburban plot and a prime-city plot can have similar land rates but face very different buyers and selling prices.
When do higher land prices reach the showflat?
There are two separate moments. The land award changes what the market knows. Developers and buyers can immediately see what a successful bidder has committed to pay. The sales launch reveals what that developer will actually ask homebuyers to pay. The second usually comes later, after the project has been prepared for sale.
- Land is bought. The acquisition cost is committed. No apartment price has been established by the land award alone.
- The project takes shape. Design, approvals, financing and preparations for sale take time. Earlier-acquired projects may still be selling.
- Homes go on sale. The new competitor’s price list becomes visible. Buyers can finally compare actual homes and budgets.
This is the lead-and-lag effect in plain terms: land costs move first; the next wave of launch prices becomes visible later. The launch is the point at which we can test how much of the higher cost has been passed to buyers. We do not have to wait until construction is finished or TOP is obtained.
Three completed journeys from land award to sales launch
The following examples match URA award dates with the developer’s own announcements of sales starting. They show the delay in practice, rather than assuming a fixed number of months for every project.
Land is bought first. Buyers see the launch later.
Months from URA's land award to the first sales the developer announced · months · Awards Apr 2023 to Nov 2024; first sales Mar 2024 to Oct 2025
- Lentor Mansion, Lentor Gardens: awarded 13 Apr 2023, first sales 15 Mar 202411.1 months
- Springleaf Residence, Upper Thomson Road (Parcel B): awarded 16 Apr 2024, first sales 15 Aug 202516 months
- Faber Residence, Faber Walk: awarded 26 Nov 2024, first sales 18 Oct 202510.7 months
Lentor Mansion 11.1 months (13 Apr 2023 to 15 Mar 2024); Springleaf Residence 16.0 months (16 Apr 2024 to 15 Aug 2025); Faber Residence 10.7 months (26 Nov 2024 to 18 Oct 2025).
Source: Past Sales Sites (Government Land Sales awards workbook) (Urban Redevelopment Authority), Awards 13 Apr 2023 to 26 Nov 2024. Extracted 22 Oct 2026.
Dates come from URA awards and developer sales releases. These examples illustrate the time lag; they do not establish an average or forecast a future sales date. Sources: URA awards and GuocoLand sales releases. First sales include VIP sales where disclosed. Three GuocoLand joint-venture examples; not a market average or a guaranteed timetable.
Show the data as a table
| Category | Months from award to first sales |
|---|---|
| Lentor Mansion, Lentor Gardens: awarded 13 Apr 2023, first sales 15 Mar 2024 | 11.1 months |
| Springleaf Residence, Upper Thomson Road (Parcel B): awarded 16 Apr 2024, first sales 15 Aug 2025 | 16 months |
| Faber Residence, Faber Walk: awarded 26 Nov 2024, first sales 18 Oct 2025 | 10.7 months |
Lentor Mansion took about 11 months from its April 2023 land award to first sales in March 2024. Springleaf Residence took about 16 months, from April 2024 to August 2025. Faber Residence took just under 11 months, from November 2024 to October 2025. Lentor Mansion release, Springleaf release, Faber release.
These are three examples from GuocoLand joint ventures, not a market-wide average or a promised timetable. We count the earliest sales date stated in each release, including VIP sales where disclosed. A showflat preview and a first booking day can be different dates.
The practical implication is that a run of higher land awards in one year can show up among launches in a later year. To judge the pipeline today, follow each awarded site to its developer-announced sales date. Do not simply add twelve months to every award.
The wider evidence: charts, all 47 sites and calculation notes
Source: the downloaded URA Past Sales Sites workbook, checked on 22 October 2026, with awards through 18 September 2026. The main sample contains all 47 awarded 99-year URA residential or residential-with-first-storey-commercial sites launched for land sale from 1 September 2022. Official source download.
It is a URA-administered sample. HDB-administered EC and mixed-use land sales, White sites and other uses are outside this pool. The large Bayshore Drive commercial/residential award is kept separate. Land figures are rounded to the nearest dollar.
Later awards have generally cost more
Middle-priced award: S$ psf ppr, among the residential-led URA awards of each year · $ psf ppr · Awards 13 Apr 2023 to 18 Sep 2026
Middle-priced award: 2023 $1,146 (8 sites), 2024 $1,191 (11), 2025 $1,331 (16), 2026 to 18 Sep $1,526 (12), $ psf ppr.
Source: Past Sales Sites (Government Land Sales awards workbook) (Urban Redevelopment Authority), Awards 13 Apr 2023 to 18 Sep 2026; workbook read 22 Oct 2026. Extracted 22 Oct 2026.
Different sites are sold each year. This is the middle award in each year’s sample, not the change in value of identical land.
Show the data as a table
| Award year | Middle-priced award |
|---|---|
| 2023 | $1,146 psf ppr |
| 2024 | $1,191 psf ppr |
| 2025 | $1,331 psf ppr |
| 2026 to 18 Sep | $1,526 psf ppr |
The middle-priced site, or median, gives each award one place in the yearly comparison. Award years contain 8, 11, 16 and 12 sites respectively. The selection changes from year to year, and 2026 is incomplete. The figures describe completed awards, not a price index tracking identical land.
The wider record: all 47 awards
Land rate: S$ psf ppr, each award in date order · $ psf ppr · Awards 13 Apr 2023 to 18 Sep 2026
- Central Region
- Outside Central Region
Note: the value axis does not start at zero. It starts at $600 psf ppr so the spread between awards can be seen; the lowest award was $793.
47 awards from $793 to $1,865 psf ppr. The lowest was Canberra Crescent (Aug 2024); the highest Peck Hay Road (Jun 2026). Every award is listed in the table below.
Source: Past Sales Sites (Government Land Sales awards workbook) (Urban Redevelopment Authority), Awards 13 Apr 2023 to 18 Sep 2026; workbook read 22 Oct 2026. Extracted 22 Oct 2026.
Every qualifying award is shown. Rates vary widely within each year. Points are spaced in award order, not to a time scale.
Show the data as a table
| Award date | Central Region | Outside Central Region |
|---|---|---|
| 2023-04-13 Lentor Gardens | – | $985 psf ppr |
| 2023-07-11 Marina Gardens Lane | $1,402 psf ppr | – |
| 2023-08-10 Jalan Tembusu | $1,069 psf ppr | – |
| 2023-09-18 Champions Way | – | $904 psf ppr |
| 2023-09-18 Lentor Central | – | $982 psf ppr |
| 2023-11-15 Clementi Avenue 1 | – | $1,250 psf ppr |
| 2023-11-15 Lorong 1 Toa Payoh | $1,360 psf ppr | – |
| 2023-11-15 Pine Grove (Parcel B) | $1,223 psf ppr | – |
| 2024-02-08 Media Circle | $1,191 psf ppr | – |
| 2024-02-21 Orchard Boulevard | $1,617 psf ppr | – |
| 2024-04-16 Upper Thomson Road (Parcel B) | – | $905 psf ppr |
| 2024-04-16 Zion Road (Parcel A) | $1,202 psf ppr | – |
| 2024-05-20 Holland Drive | $1,285 psf ppr | – |
| 2024-06-27 River Valley Green (Parcel A) | $1,325 psf ppr | – |
| 2024-08-07 Canberra Crescent | – | $793 psf ppr |
| 2024-08-07 De Souza Avenue | $841 psf ppr | – |
| 2024-08-07 Margaret Drive | $1,154 psf ppr | – |
| 2024-08-07 Zion Road (Parcel B) | $1,304 psf ppr | – |
| 2024-11-26 Faber Walk | – | $900 psf ppr |
| 2025-01-21 Dairy Farm Walk | – | $1,020 psf ppr |
| 2025-01-21 Tengah Garden Avenue | – | $821 psf ppr |
| 2025-02-13 River Valley Green (Parcel B) | $1,420 psf ppr | – |
| 2025-03-13 Media Circle (Parcel A) | $1,037 psf ppr | – |
| 2025-03-28 Bayshore Road | – | $1,388 psf ppr |
| 2025-04-09 Lentor Gardens | – | $920 psf ppr |
| 2025-06-09 Lakeside Drive | – | $1,132 psf ppr |
| 2025-07-03 Dunearn Road | $1,410 psf ppr | – |
| 2025-07-17 Chuan Grove | – | $1,376 psf ppr |
| 2025-08-07 Holland Link | $1,432 psf ppr | – |
| 2025-09-10 Chuan Grove (1H2025) | – | $1,331 psf ppr |
| 2025-10-16 Dorset Road | $1,338 psf ppr | – |
| 2025-10-31 Upper Thomson Road (Parcel A) | – | $1,062 psf ppr |
| 2025-11-20 Telok Blangah Road | $1,326 psf ppr | – |
| 2025-11-21 Bukit Timah Road | $1,820 psf ppr | – |
| 2025-12-02 Bedok Rise | – | $1,330 psf ppr |
| 2026-01-28 Dairy Farm Walk | – | $962 psf ppr |
| 2026-02-10 Tanjong Rhu Road | $1,455 psf ppr | – |
| 2026-03-06 Lentor Central | – | $1,278 psf ppr |
| 2026-03-31 Dover Drive | $1,556 psf ppr | – |
| 2026-04-10 Kallang Close | $1,415 psf ppr | – |
| 2026-05-04 Dunearn Road | $1,625 psf ppr | – |
| 2026-05-12 Holland Plain | $1,491 psf ppr | – |
| 2026-06-16 Peck Hay Road | $1,865 psf ppr | – |
| 2026-06-23 River Valley Green (Parcel C) | $1,730 psf ppr | – |
| 2026-08-07 Berlayar Drive | $1,515 psf ppr | – |
| 2026-09-04 New Upper Changi Road | – | $1,537 psf ppr |
| 2026-09-18 Lorong Puntong / Sin Ming Avenue | $1,612 psf ppr | – |
The three coloured location sequences near the top include every qualifying award in the defined River Valley Green / Zion Road, Upper Thomson Road and Dunearn Road groups. These groups illustrate local sequences; they were not selected to estimate a national growth rate. The lower later awards discussed in the main text remain in the full dataset.
We also checked other ways of grouping the data. Restricting it to 35 pure non-landed residential sites still gives a higher middle-priced award in 2026 than in 2023. Adding the large Bayshore Drive commercial and residential award (20 July 2026, about $1,323 psf ppr), which sits outside the main sample, moves the 2026 middle figure to about $1,515. That this matches the figure without Dover Drive is a coincidence of two different calculations, not the same filter. Removing Zion Road Parcel A leaves the 2024 figure at about $1,173. These checks do not remove site differences.
The calculation is tender price divided by permitted GFA in square metres, multiplied by 0.09290304 to express dollars per square foot. All 47 rows reconcile with the workbook’s published rates within rounding. Dates are awards, not tender-closing dates. The original workbook has not been changed.
An awards file does not contain every offered site: Media Circle Parcel B received no bids in April 2025, for example. Failed or unawarded tenders have no completed acquisition price to plot. URA’s no-bid announcement.
Download all 47 land-award calculations · Download the three award-to-sales timelines
| Award | Land parcel | Region | Land rate, psf ppr |
|---|---|---|---|
| 2023-04-13 | Lentor Gardens | Outside Central Region | $985 |
| 2023-07-11 | Marina Gardens Lane | Central Region | $1,402 |
| 2023-08-10 | Jalan Tembusu | Central Region | $1,069 |
| 2023-09-18 | Champions Way | Outside Central Region | $904 |
| 2023-09-18 | Lentor Central | Outside Central Region | $982 |
| 2023-11-15 | Clementi Avenue 1 | Outside Central Region | $1,250 |
| 2023-11-15 | Lorong 1 Toa Payoh | Central Region | $1,360 |
| 2023-11-15 | Pine Grove (Parcel B) | Central Region | $1,223 |
| 2024-02-08 | Media Circle | Central Region | $1,191 |
| 2024-02-21 | Orchard Boulevard | Central Region | $1,617 |
| 2024-04-16 | Upper Thomson Road (Parcel B) | Outside Central Region | $905 |
| 2024-04-16 | Zion Road (Parcel A) | Central Region | $1,202 |
| 2024-05-20 | Holland Drive | Central Region | $1,285 |
| 2024-06-27 | River Valley Green (Parcel A) | Central Region | $1,325 |
| 2024-08-07 | Canberra Crescent | Outside Central Region | $793 |
| 2024-08-07 | De Souza Avenue | Central Region | $841 |
| 2024-08-07 | Margaret Drive | Central Region | $1,154 |
| 2024-08-07 | Zion Road (Parcel B) | Central Region | $1,304 |
| 2024-11-26 | Faber Walk | Outside Central Region | $900 |
| 2025-01-21 | Dairy Farm Walk | Outside Central Region | $1,020 |
| 2025-01-21 | Tengah Garden Avenue | Outside Central Region | $821 |
| 2025-02-13 | River Valley Green (Parcel B) | Central Region | $1,420 |
| 2025-03-13 | Media Circle (Parcel A) | Central Region | $1,037 |
| 2025-03-28 | Bayshore Road | Outside Central Region | $1,388 |
| 2025-04-09 | Lentor Gardens | Outside Central Region | $920 |
| 2025-06-09 | Lakeside Drive | Outside Central Region | $1,132 |
| 2025-07-03 | Dunearn Road | Central Region | $1,410 |
| 2025-07-17 | Chuan Grove | Outside Central Region | $1,376 |
| 2025-08-07 | Holland Link | Central Region | $1,432 |
| 2025-09-10 | Chuan Grove (1H2025) | Outside Central Region | $1,331 |
| 2025-10-16 | Dorset Road | Central Region | $1,338 |
| 2025-10-31 | Upper Thomson Road (Parcel A) | Outside Central Region | $1,062 |
| 2025-11-20 | Telok Blangah Road | Central Region | $1,326 |
| 2025-11-21 | Bukit Timah Road | Central Region | $1,820 |
| 2025-12-02 | Bedok Rise | Outside Central Region | $1,330 |
| 2026-01-28 | Dairy Farm Walk | Outside Central Region | $962 |
| 2026-02-10 | Tanjong Rhu Road | Central Region | $1,455 |
| 2026-03-06 | Lentor Central | Outside Central Region | $1,278 |
| 2026-03-31 | Dover Drive | Central Region | $1,556 |
| 2026-04-10 | Kallang Close | Central Region | $1,415 |
| 2026-05-04 | Dunearn Road | Central Region | $1,625 |
| 2026-05-12 | Holland Plain | Central Region | $1,491 |
| 2026-06-16 | Peck Hay Road | Central Region | $1,865 |
| 2026-06-23 | River Valley Green (Parcel C) | Central Region | $1,730 |
| 2026-08-07 | Berlayar Drive | Central Region | $1,515 |
| 2026-09-04 | New Upper Changi Road | Outside Central Region | $1,537 |
| 2026-09-18 | Lorong Puntong / Sin Ming Avenue | Central Region | $1,612 |
Source: Past Sales Sites (Government Land Sales awards workbook) (Urban Redevelopment Authority), Awards 13 Apr 2023 to 18 Sep 2026; workbook read 22 Oct 2026. Extracted 22 Oct 2026.